Market Outlook
December 4, 2017
Market Cues
Domestic Indices
Chg (%)
(Pts)
(Close)
Indian markets are likely to open positive tracking global indices and SGX Nifty.
BSE Sensex
(1.0)
(316)
32,833
After falling sharply in late morning trading, US markets climbed well off their worst
Nifty
(1.0)
(105)
10,122
levels of the day but still ended the day modestly lower. The Dow and the S&P 500
Mid Cap
(0.9)
(160)
16,757
pulled back off the record closing highs set in the previous session. The Dow slipped
Small Cap
(1.2)
(211)
18,017
0.2% to 24,232, the Nasdaq fell 0.4% to 6,848 and the S&P 500 dipped 0.2% to
2,642.
Bankex
(0.7)
(195)
28,436
The UK's benchmark FTSE 100 index ended 26.18 points lower at 7,300. The pound
Global Indices
Chg (%)
(Pts)
(Close)
broke through the $1.35 level on Thursday amid hopes of a settlement on the so-
called Brexit divorce bill and the Irish border issue.
Dow Jones
(0.2)
(41)
24,232
Nasdaq
(0.4)
(26)
6,848
BSE Sensex and NSE Nifty closed about 1% lower on Friday as GDP data failed to
FTSE
(0.4)
(26)
7,300
cheer the markets. India’s 2QFY18 GDP growth came at 6.3%, up from a three-year
low of 5.7% in 1QFY18. While the data shows strong recovery in the domestic
Nikkei
0.4
94
22,819
economy, it was still not enough to lift up the mood of the investors who had
Hang Seng
(0.4)
(103)
29,074
expected growth of 6.4% in the quarter.
Shanghai Com
0.0
0
3,318
News Analysis
Advances / Declines
BSE
NSE
November automobile sales analysis
Advances
1,015
606
Detailed analysis on Pg2
Declines
1,713
1,151
Investor’s Ready Reckoner
Unchanged
138
56
Key Domestic & Global Indicators
Volumes (` Cr)
Stock Watch: Latest investment recommendations on 150+ stocks
Refer Pg5 onwards
BSE
4,430
NSE
28,450
Top Picks
CMP
Target
Upside
Company
Sector
Rating
(`)
(`)
(%)
Net Inflows (` Cr)
Net
Mtd
Ytd
Blue Star
Capital Goods
Buy
745
867
16.3
FII
(622)
19,783
58,235
Dewan Housing Finance
Financials
Buy
600
712
18.7
MFs
300
10,669
106,079
Asian Granito
Other
Accumulate
505
570
12.8
Navkar Corporation
Other
Buy
184
265
43.7
KEI Industries
Capital Goods Accumulate
387
425
9.8
Top Gainers
Price (`)
Chg (%)
More Top Picks on Pg4
Ltts
1,099
8.3
Jubilant
693
5.6
Key Upcoming Events
Previous
Consensus
Videoind
16
4.9
Date
Region
Event Description
Reading
Expectations
Advenzymes
289
4.8
Dec05
UK
PMI Manufacturing
56.30
56.50
Tifhl
586
4.1
Dec05
Euro Zone Euro-Zone GDP s.a. (QoQ)
0.60
Dec06
India
RBI Reverse Repo rate
5.75
5.75
Dec06
India
RBI Repo rate
6.00
6.00
Top Losers
Price (`)
Chg (%)
Dec06
India
RBI Cash Reserve ratio
4.00
4.00
Mcleodruss
220
(6.4)
More Events on Pg7
Kpit
161
(6.0)
Hathway
41
(5.4)
Sobha
590
(5.3)
Syndibank
88
(5.2)
As on December 01 2017
Market Outlook
December 4, 2017
News Analysis
November Automobile sales analysis
Maruti Suzuki in line with expectations - Maruti Suzuki reported total 14.1%
growth in its total vehicles. Domestic PV volumes grew by 14.3% yoy while
exports grew by 0.8% yoy. Its LCV, Super Carry has also reported more than
1,000 volumes for the second month in row. The utility vehicle volumes grew
by 34%, fastest in the last four months. While entry level, Mini segment
reported 1.8% yoy drop in the volumes, compact range vehicles reported
32.4% yoy growth fuelled by Baleno and Ignis. Overall, the numbers are
along our expectations and we believe that with the robust order book and
new launches, company is expected to report healthy volume growth going
ahead.
Bajaj Auto - Exports continue to shine, 3Ws put a robust shown - Aided by
strong show in the 3Ws, Bajaj auto has reported 20.9% yoy growth in the
November volumes. The domestic 2W sales were flat on yoy basis as
company sold over 2 lakh vehicles in the earlier three months. Also with the
scooterization continued, motorbikes have continued to lose market share in
the 2W space to the scooters. Domestic scooter volumes grew by 157% yoy
to 37887 units. This was helped by lower base created by demonetization in
November-2016 and better monsoon. On the exports front, company has
shown 24.5% yoy growth in 2W exports and 41.1% growth in 3W exports.
Expansion in the new countries has clearly helped the company to report
good set of numbers on the exports front.
Ashok Leyland shows strong growth in CV numbers - Ashok Leyland’s
November volumes have surprised positively. With total volumes growing by
51% yoy, November has signed that volume growth will remain solid going
ahead. MHCV volumes were up 54% yoy while LCV volumes were up 44%.
The recovery in the industries and public capex is expected to boost the CV
volumes further and we believe, Ashok Leyland, due to its pure play CV
business is expected to gain market share.
Economic and Political News
U.S. Senate passes tax-cut bill in milestone move
Govt expects Rs 75Kcr from 34 mine auctions in FY18
GST rate cut boosts Nov manufacturing PMI to 52.6, fastest since Oct 2016
Corporate News
Infosys appoints Salil Parekh as MD and CEO
Dr. Reddy’s Labs gets EIR from U.S. FDA for CPS facility at Telangana
Mukesh Ambani to look at agriculture, education, healthcare
Steel Strips Wheels extends rally on export order for 6000 truck wheels
Biocon, Mylan get U.S. FDA approval for biosimilar to Roche’s cancer drug
Market Outlook
December 4, 2017
Top Picks
Market Cap
CMP
Target
Upside
Company
Rationale
(` Cr)
(`)
(`)
(%)
Strong growth in domestic business due to its leade`hip
in acute therapeutic segment. Alkem expects to launch
Alkem Laboratories
23,615
1,975
2,125
7.6
more products in USA, which bodes for its international
business.
We expect the company would report strong profitability
Asian Granito
1,521
505
570
12.8
owing to better product mix, higher B2C sales and
amalgamation synergy.
Favorable outlook for the AC industry to augur well for
Cooling products business which is out pacing the
Blue Star
7,145
745
867
16.3
market growth. EMPPAC division's profitability to
improve once operating environment turns around.
With a focus on the low and medium income (LMI)
consumer segment, the company has increased its
Dewan Housing Finance
18,815
600
712
18.7
presence in tier-II & III cities where the growth
opportunity is immense.
Loan growth is likely to pick up after a sluggish FY17.
Lower credit cost will help in strong bottom-line growth.
Karur Vysya Bank
8,411
117
180
54.4
Increasing share of CASA will help in NIM
improvement.
High order book execution in EPC segment, rising B2C
KEI Industries
3,032
387
425
9.8
sales and higher exports to boost the revenues and
profitability
Expected to benefit from the lower capex requirement
Music Broadcast
2,166
380
434
14.3
and 15 year long radio broadcast licensing.
Massive capacity expansion along with rail advantage
Navkar Corporation
2,776
184
265
43.7
at ICD as well CFS augur well for the company
Strong brands and distribution network would boost
Siyaram Silk Mills
3,221
687
721
5.0
growth going ahead. Stock currently trades at an
inexpensive valuation.
Market leadership in Hindi news genre and no.
2
viewership ranking in English news genre, exit from the
TV Today Network
2,287
383
435
13.5
radio business, and anticipated growth in ad spends by
corporate to benefit the stock.
After GST, the company is expected to see higher
volumes along with improving product mix. The Gujarat
Maruti Suzuki
260,017
8,608
9,489
10.2
plant will also enable higher operating leverage which
will be margin accretive.
We expect loan book to grow at 24.3% over next two
GIC Housing
2,343
435
655
50.5
year; change in borrowing mix will help in NIM
improvement
We expect CPIL to report net Revenue/PAT CAGR of
~17%/16% over FY2017-20E mainly due to healthy
6,927
312
400
28.3
growth in plywood & lamination business, forayed into
Century Plyboards India
MDF & Particle boards on back of strong brand &
distribution network.
We expect sales/PAT to grow at 13.5%/20% over next
LT Foods
1,882
71
96
36.1
two years on the back of strong distribution network &
addition of new products in portfolio.
Source: Company, Angel Research
Market Outlook
December 4, 2017
Key Upcoming Events
Global economic events release calendar
Bloomberg Data
Date
Time Country
Event Description
Unit
Period
Last Reported
Estimated
Dec 05, 2017
3:00 PMUK
PMI Manufacturing
Value
Nov
56.30
56.50
3:30 PMEuro Zone
Euro-Zone GDP s.a. (QoQ)
% Change
3Q F
0.60
Dec 06, 2017
2:30 PMIndia
RBI Reverse Repo rate
%
Dec 6
5.75
5.75
2:30 PMIndia
RBI Repo rate
%
Dec 6
6.00
6.00
2:30 PMIndia
RBI Cash Reserve ratio
%
Dec 6
4.00
4.00
Dec 08, 2017
3:00 PMUK
Industrial Production (YoY)
% Change
Oct
2.50
India
Imports YoY%
% Change
Nov
7.60
India
Exports YoY%
% Change
Nov
(1.10)
China
Exports YoY%
% Change
Nov
6.90
7:00 PMUS
Change in Nonfarm payrolls
Thousands
Nov
261.00
198.00
7:00 AMChina
Consumer Price Index (YoY)
% Change
Nov
1.90
1.80
Dec 09, 2017
7:00 PMUS
Unnemployment rate
%
Nov
4.10
4.10
Dec 12, 2017
5:30 PMIndia
Industrial Production YoY
% Change
Oct
3.80
3:00 PMUK
CPI (YoY)
% Change
Nov
3.00
US
Producer Price Index (mom)
% Change
Nov
0.20
Dec 13, 2017
3:00 PMUK
Jobless claims change
% Change
Nov
1.10
7:00 PMUS
Consumer price index (mom)
% Change
Nov
0.10
0.40
Dec 14, 2017
7:30 AMChina
Industrial Production (YoY)
% Change
Nov
6.20
12:00 PMIndia
Monthly Wholesale Prices YoY%
% Change
Nov
3.59
5:30 PMUK
BOE Announces rates
% Ratio
Dec 14
0.50
0.50
6:15 PMEuro Zone
ECB announces interest rates
%
Dec 14
-
7:45 PMUS
Industrial Production
%
Nov
0.94
Dec 15, 2017
3:30 PMEuro Zone
Euro-Zone CPI (YoY)
%
Nov F
1.40
Dec 18, 2017
12:30 AMUS
FOMC rate decision
%
Dec 13
1.25
1.50
Source: Bloomberg, Angel Research
Market Outlook
December 4, 2017
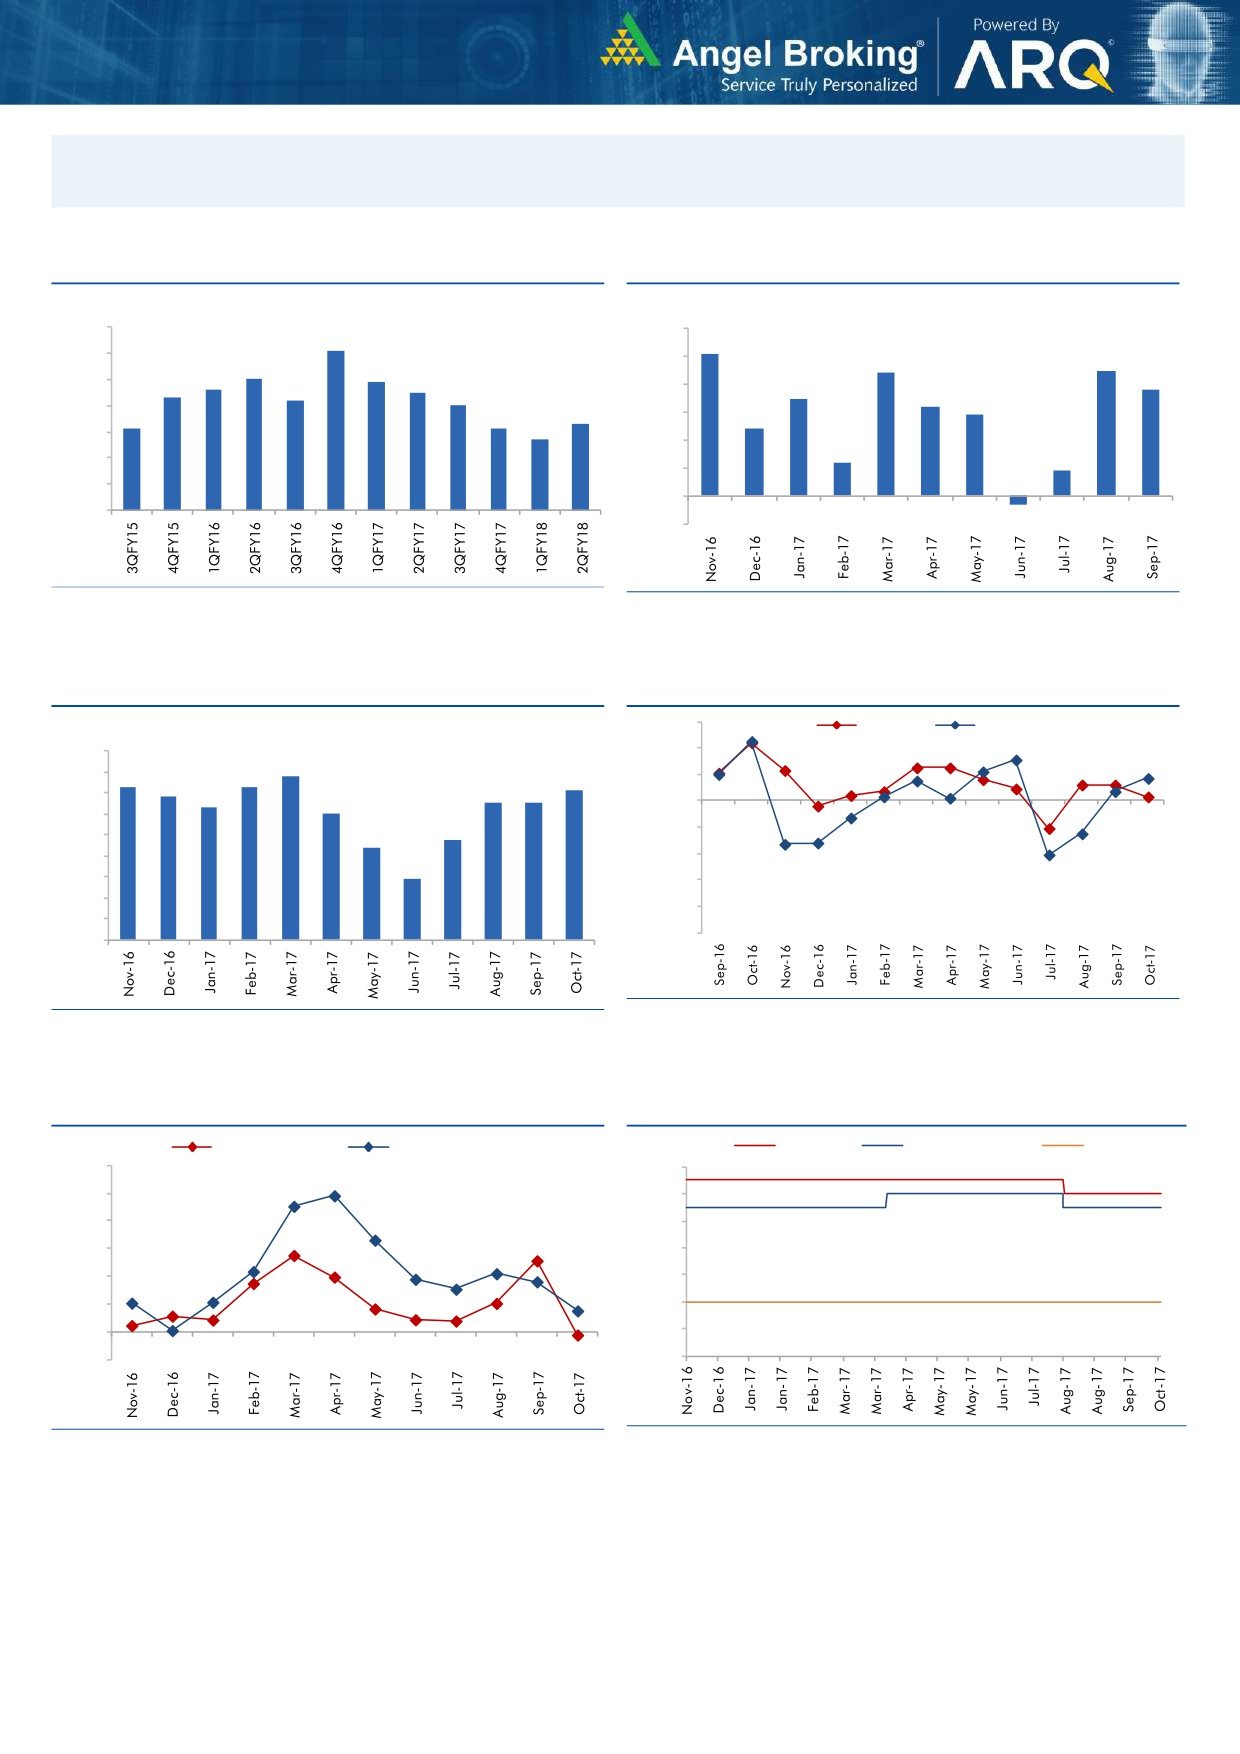
Macro watch
Exhibit 1: Quarterly GDP trends
Exhibit 2: IIP trends
(%)
(%)
10.0
6.0
9.1
5.1
9.0
5.0
4.4
4.5
8.0
7.9
7.6
7.5
3.8
8.0
7.3
7.2
4.0
3.5
7.0
3.2
2.9
7.0
6.3
6.1
6.1
3.0
2.4
5.7
6.0
2.0
1.2
5.0
0.9
1.0
4.0
-
3.0
(1.0)
(0.3)
Source: CSO, Angel Research
Source: MOSPI, Angel Research
Exhibit 3: Monthly CPI inflation trends
Exhibit 4: Manufacturing and services PMI
56.0
Mfg. PMI
Services PMI
(%)
4.5
54.0
3.9
4.0
3.6
3.7
3.6
52.0
3.4
3.2
3.3
3.3
3.5
3.0
50.0
3.0
2.4
48.0
2.5
2.2
2.0
46.0
1.5
1.5
44.0
1.0
42.0
0.5
40.0
-
Source: Market, Angel Research; Note: Level above 50 indicates expansion
Source: MOSPI, Angel Research
Exhibit 5: Exports and imports growth trends
Exhibit 6: Key policy rates
(%)
Exports yoy growth
Imports yoy growth
(%)
Repo rate
Reverse Repo rate
CRR
60.0
6.50
50.0
6.00
40.0
5.50
30.0
5.00
20.0
4.50
10.0
4.00
0.0
3.50
(10.0)
3.00
Source: Bloomberg, Angel Research
Source: RBI, Angel Research
Market Outlook
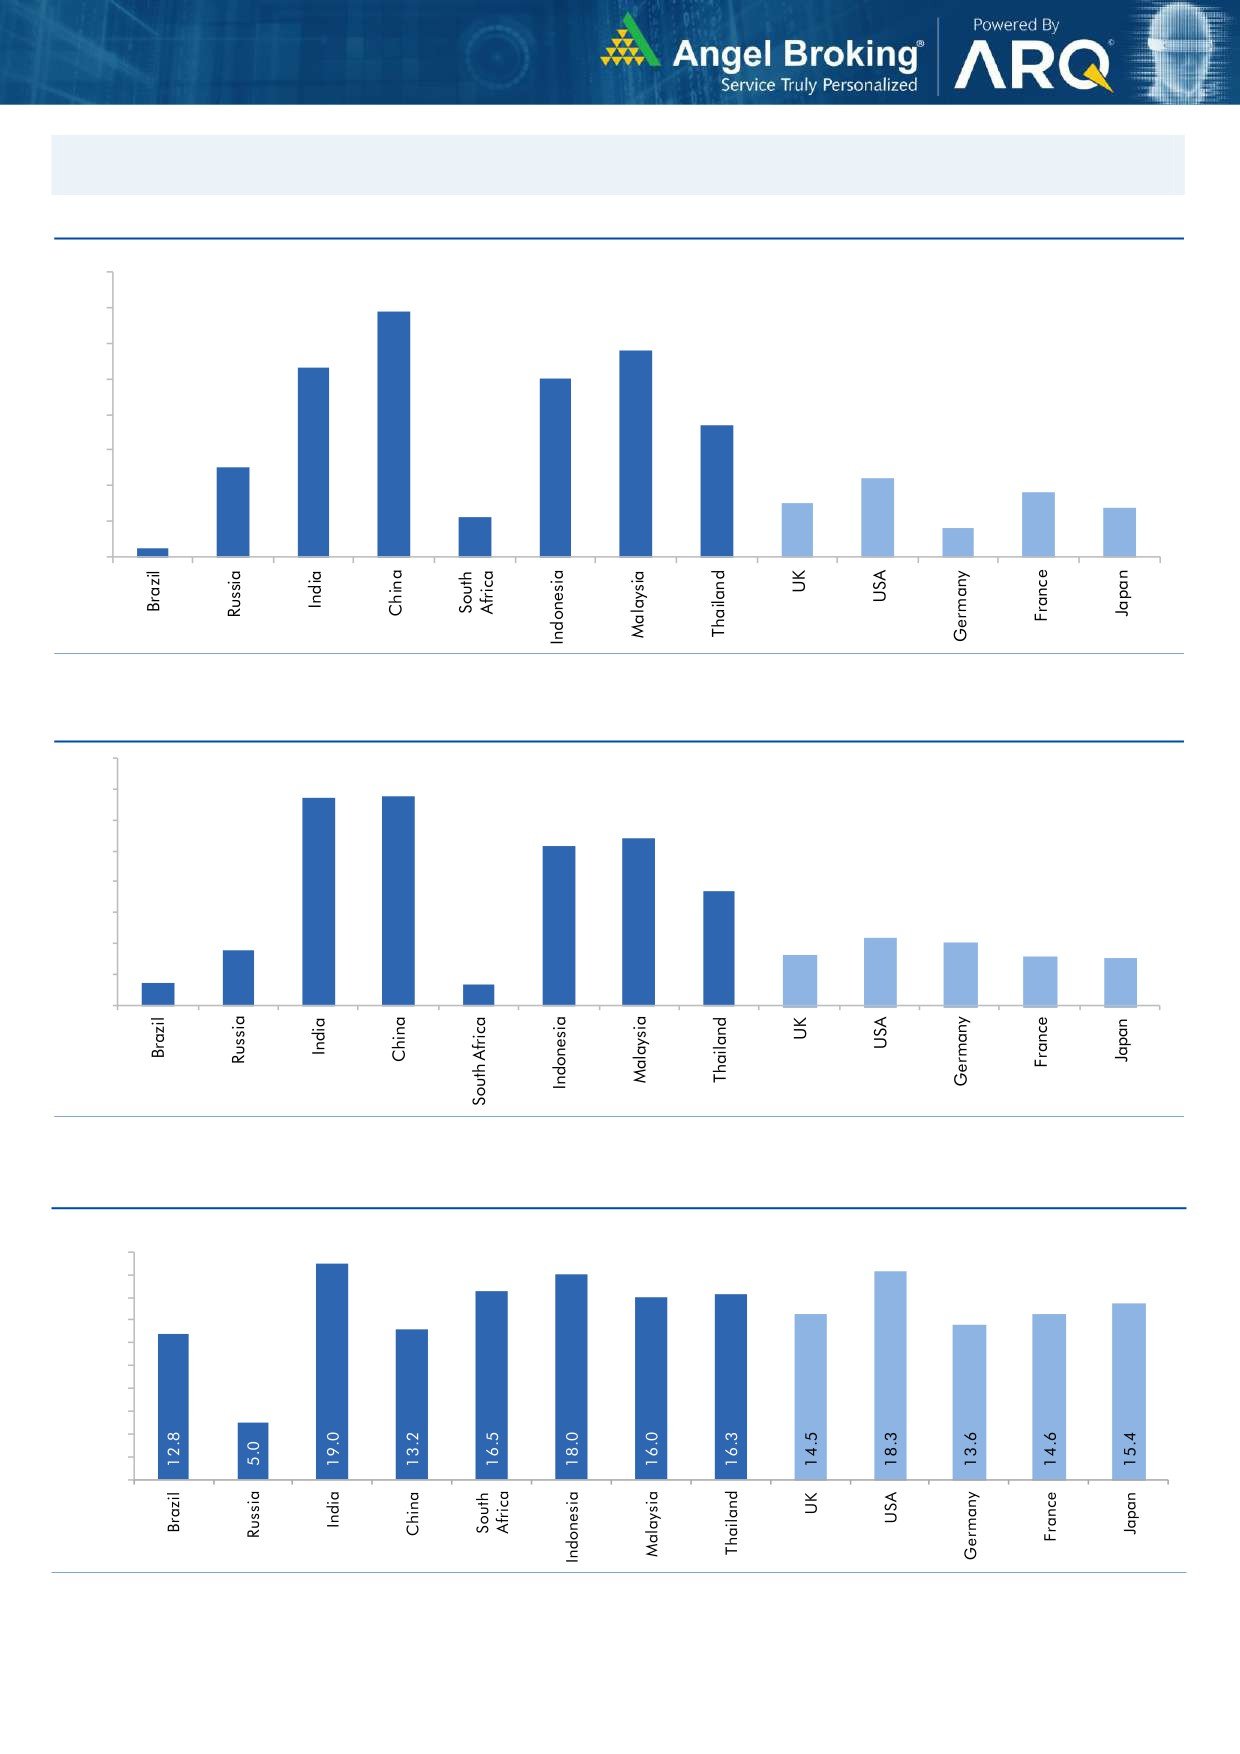
December 4, 2017
Global watch
Exhibit 1: Latest quarterly GDP Growth (%, yoy) across select developing and developed countries
(%)
8.0
6.9
7.0
5.8
6.0
5.3
5.0
5.0
1.1
3.7
4.0
2.5
3.0
2.2
1.8
2.0
1.5
1.4
0.8
1.0
0.3
-
Source: Bloomberg, Angel Research
Exhibit 2: 2017 GDP Growth projection by IMF (%, yoy) across select developing and developed countries
(%)
6.7
6.8
7.0
6.0
5.4
5.2
5.0
3.7
4.0
3.0
1.8
2.2
2.0
1.7
1.6
2.0
0.7
1.5
0.7
1.0
-
Source: IMF, Angel Research
Exhibit 3: One year forward P-E ratio across select developing and developed countries
(x)
20.0
18.0
16.0
14.0
12.0
10.0
8.0
6.0
4.0
2.0
-
Source: IMF, Angel Research
Market Outlook
December 4, 2017
Exhibit 4: Relative performance of indices across globe
Returns (%)
Country
Name of index
Closing price
1M
3M
1YR
Brazil
Bovespa
72,264
(4.9)
1.8
15.0
Russia
Micex
2,106
2.0
4.7
(2.4)
India
Nifty
10,122
(3.1)
2.1
23.1
China
Shanghai Composite
3,318
(2.3)
(1.3)
2.4
South Africa
Top 40
52,888
(0.3)
5.8
21.3
Mexico
Mexbol
47,265
(3.3)
(7.7)
5.2
Indonesia
LQ45
992
(0.0)
1.3
16.9
Malaysia
KLCI
1,718
(1.7)
(2.9)
5.4
Thailand
SET 50
1,089
0.0
5.3
16.7
USA
Dow Jones
24,232
3.7
10.4
26.4
UK
FTSE
7,300
(2.2)
(1.5)
8.9
Japan
Nikkei
22,819
3.3
16.8
24.0
Germany
DAX
12,861
(4.5)
6.7
19.4
France
CAC
5,317
(3.6)
4.2
11.6
Source: Bloomberg, Angel Research p68in4
Stock Watch
December 04, 2017
Company Name
Reco
CMP
Target
Mkt Cap
Sales ( Čcr )
OPM(%)
EPS (Č)
PER(x)
P/BV(x)
RoE(%)
EV/Sales(x)
(Č)
Price ( Č)
( Č cr )
FY18E FY19E
FY18E
FY19E
FY18E
FY19E
FY18E
FY19E
FY18E
FY19E
FY18E
FY19E
FY18E
FY19E
Agri / Agri Chemical
Rallis
Reduce
240
209
4,668
1,873
2,099
15.0
15.0
9.5
10.5
25.3
22.9
3.8
3.5
15.8
16.0
2.4
2.2
United Phosphorus
Accumulate
730
820
37,092
18,922
21,949
18.0
18.5
36.2
45.6
20.2
16.0
4.2
3.5
22.7
23.8
2.1
1.8
Auto & Auto Ancillary
Ashok Leyland
Accumulate
120
127
35,125
23,339
27,240
10.1
10.8
4.7
6.2
25.8
19.3
5.2
4.6
20.0
23.6
1.5
1.2
Bajaj Auto
Neutral
3,213
-
92,963
23,936
27,955
19.5
20.1
142.7
167.3
22.5
19.2
4.9
4.4
21.8
22.8
3.5
2.9
Bharat Forge
Buy
685
875
31,897
7,637
8,755
21.7
23.2
36.1
47.3
19.0
14.5
3.4
2.9
18.5
20.8
4.0
3.4
Eicher Motors
Neutral
29,281
-
79,710
19,043
22,837
19.5
19.9
835.4
1,019.0
35.1
28.7
13.1
10.1
40.9
37.8
4.1
3.3
Gabriel India
Neutral
186
-
2,672
1,782
2,033
9.7
10.2
7.1
8.9
26.2
21.0
5.3
4.5
21.0
22.2
1.5
1.2
Hero Motocorp
Accumulate
3,607
4,129
72,033
32,239
36,878
16.0
15.6
184.4
206.5
19.6
17.5
6.1
5.4
31.3
30.7
2.0
1.7
Jamna Auto Industries Neutral
63
-
2,514
1,441
1,662
14.4
14.8
13.9
17.6
4.5
3.6
1.2
1.0
30.0
31.0
1.7
1.5
Mahindra and Mahindra Neutral
1,409
-
87,598
46,971
53,816
13.6
14.0
67.7
79.8
20.8
17.7
3.0
2.7
15.0
15.9
1.8
1.5
Maruti
Accumulate
8,608
9,489
260,017
79,470
95,208
15.9
17.2
281.7
363.8
30.6
23.7
6.6
5.4
21.7
22.8
2.9
2.4
Minda Industries
Neutral
1,247
-
10,780
4,328
5,084
11.0
11.9
27.3
36.4
45.8
34.3
9.7
7.6
23.1
25.6
2.6
2.2
Motherson Sumi
Neutral
358
-
75,365
55,937
64,445
10.8
11.4
16.9
21.1
21.2
17.0
4.7
4.8
25.2
25.4
1.4
1.2
Tata Motors
Neutral
399
-
115,249
303,167
343,649
11.8
13.8
33.1
54.7
12.1
7.3
2.0
1.6
16.9
23.0
0.4
0.4
TVS Motor
Neutral
724
-
34,418
13,992
16,216
9.0
9.4
17.1
20.3
42.5
35.7
11.3
8.7
29.7
27.7
2.4
2.0
Amara Raja Batteries
Accumulate
774
858
13,228
6,140
7,122
14.3
15.6
29.3
39.0
26.4
19.9
4.5
3.8
17.1
19.0
2.2
1.8
Exide Industries
Neutral
205
-
17,425
8,689
9,854
15.1
15.2
9.7
11.0
21.2
18.6
3.8
3.3
15.7
16.1
1.7
1.5
Apollo Tyres
Neutral
244
-
13,952
15,739
17,326
13.3
14.6
20.4
26.7
12.0
9.1
1.5
1.3
20.4
26.7
1.1
1.0
Ceat
Neutral
1,744
-
7,053
6,661
7,717
11.1
14.2
116.2
178.2
15.0
9.8
2.6
2.2
15.2
21.3
1.2
1.0
JK Tyres
Neutral
142
-
3,217
8,318
9,239
16.2
16.4
21.0
27.5
6.8
5.2
1.3
1.1
19.1
20.4
0.8
0.7
Swaraj Engines
Neutral
1,948
-
2,420
788
889
16.4
16.5
71.6
81.0
27.2
24.1
7.8
7.3
29.6
31.0
2.7
2.4
Subros
Neutral
255
-
1,529
1,855
2,135
11.6
11.8
10.3
14.7
24.9
17.4
3.8
3.2
15.8
19.1
1.0
0.9
Capital Goods
BEML
Neutral
1,642
-
6,836
4,286
5,194
7.1
8.2
42.9
58.1
38.3
28.3
3.1
2.9
7.6
8.7
1.7
1.3
Bharat Electronics
Neutral
185
-
45,331
10,258
12,470
19.6
19.5
7.3
8.6
25.3
21.5
0.5
0.4
20.4
21.9
3.9
3.2
Voltas
Neutral
617
-
20,401
6,778
8,004
9.6
11.0
17.1
22.4
36.1
27.5
8.6
7.5
17.7
19.8
2.7
2.3
BHEL
Neutral
91
-
33,355
33,200
39,167
6.8
9.5
6.2
11.2
14.7
8.1
0.7
0.6
4.6
8.0
0.6
0.4
Blue Star
Buy
745
867
7,145
5,220
6,207
6.3
6.6
16.8
22.3
44.4
33.4
8.8
7.8
19.9
23.3
1.3
1.1
CG Power and Industrial
Neutral
84
-
5,265
6,555
7,292
7.5
7.5
-
0.8
8,400.0
105.0
1.3
1.3
0.1
1.2
0.9
0.8
Solutions
Greaves Cotton
Neutral
118
-
2,890
1,778
1,993
14.7
15.1
8.1
9.1
14.6
13.0
3.3
3.1
21.8
23.6
1.4
1.2
Stock Watch
December 04, 2017
Company Name
Reco
CMP
Target
Mkt Cap
Sales ( Čcr )
OPM(%)
EPS (Č)
PER(x)
P/BV(x)
RoE(%)
EV/Sales(x)
(Č)
Price ( Č)
( Č cr )
FY18E FY19E
FY18E
FY19E
FY18E
FY19E
FY18E
FY19E
FY18E
FY19E
FY18E
FY19E
FY18E
FY19E
Capital Goods
KEC International
Accumulate
314
350
8,069
9,779
11,113
9.4
9.8
14.2
18.2
22.1
17.2
4.2
3.5
21.1
22.1
1.1
1.0
KEI Industries
Accumulate
387
425
3,032
3,001
3,391
10.0
10.0
13.0
16.1
29.7
24.0
5.4
4.5
18.2
18.7
1.2
1.0
Thermax
Neutral
1,102
-
13,126
4,125
4,747
10.3
10.8
26.7
31.5
41.3
35.0
4.6
4.2
11.2
12.0
2.9
2.5
VATech Wabag
Accumulate
595
681
3,248
3,867
4,126
9.6
10.0
34.9
39.8
17.1
15.0
2.8
2.4
17.7
17.5
0.9
0.8
Cement
ACC
Neutral
1,677
-
31,492
12,255
13,350
13.5
14.3
58.0
66.2
28.9
25.3
3.4
3.2
11.5
12.2
2.5
2.3
Ambuja Cements
Neutral
264
-
52,342
10,250
11,450
17.5
19.0
7.2
8.3
36.6
31.8
2.6
2.5
7.0
7.8
4.9
4.3
India Cements
Neutral
168
-
5,191
6,135
6,750
14.8
15.2
8.5
11.5
19.8
14.7
1.0
0.9
4.8
6.2
1.2
1.0
JK Cement
Neutral
986
-
6,892
4,150
4,775
19.2
20.0
49.0
63.5
20.1
15.5
3.2
2.7
17.0
18.5
2.1
1.8
J K Lakshmi Cement
Neutral
409
-
4,810
3,422
3,757
15.5
17.0
13.5
23.2
30.3
17.6
3.1
2.7
10.8
15.5
1.8
1.6
Orient Cement
Neutral
163
-
3,338
2,215
3,233
16.8
17.0
5.9
6.9
27.6
23.6
2.1
2.0
10.8
10.1
2.5
1.7
UltraTech Cement
Neutral
4,173
-
114,562
28,250
35,150
20.2
23.5
77.5
122.2
53.8
34.2
4.5
4.1
9.6
14.8
4.5
3.6
Construction
KNR Constructions
Neutral
270
-
3,797
1,846
2,203
14.5
14.5
12.1
13.7
22.3
19.8
1.2
1.1
17.5
16.7
2.1
1.8
Larsen & Toubro
Neutral
1,213
-
169,889
95,787
109,476
10.2
11.6
44.5
50.8
27.3
23.9
3.4
3.1
12.9
13.1
2.3
2.1
Gujarat Pipavav Port
Neutral
140
-
6,783
739
842
61.6
62.7
5.1
6.2
27.5
22.8
3.4
3.3
12.7
14.9
8.6
7.5
PNC Infratech
Neutral
188
-
4,829
2,040
2,935
13.0
13.0
6.4
9.0
29.4
20.9
0.8
0.7
9.7
12.2
2.4
1.7
Simplex Infra
Neutral
575
-
2,847
6,012
6,619
11.6
11.7
21.1
31.0
27.3
18.6
1.9
1.7
6.5
8.6
1.0
0.9
Sadbhav Engineering
Neutral
379
-
6,502
3,823
4,426
10.7
10.8
10.3
11.8
36.8
32.1
4.4
3.9
10.1
10.5
2.0
1.8
NBCC
Neutral
261
-
23,445
9,099
12,706
6.4
6.4
7.3
9.6
35.8
27.2
1.6
1.3
27.5
30.5
2.4
1.8
MEP Infra
Neutral
98
-
1,585
2,403
2,910
18.3
16.8
2.4
6.1
41.5
16.1
15.7
10.6
35.2
55.8
1.8
1.5
SIPL
Neutral
136
-
4,792
2,060
2,390
46.8
47.7
(5.8)
(3.1)
5.1
5.8
(14.2)
(2.3)
7.1
6.6
Engineers India
Neutral
182
-
12,234
1,795
2,611
21.1
22.4
5.9
8.1
30.8
22.4
2.2
2.1
12.9
16.1
5.2
3.4
Financials
Axis Bank
Accumulate
534
580
127,977
32,558
35,843
3.5
3.2
27.8
41.0
19.2
13.0
2.1
1.8
11.4
14.9
-
-
Bank of Baroda
Neutral
168
-
38,652
22,533
26,079
2.4
2.4
12.0
20.9
14.0
8.0
0.9
0.9
6.6
11.0
-
-
Canara Bank
Neutral
363
-
21,670
17,925
20,235
2.0
2.1
18.5
36.5
19.6
9.9
0.7
0.7
3.4
6.2
-
-
Can Fin Homes
Neutral
467
-
6,216
586
741
3.5
3.5
107.8
141.0
4.3
3.3
1.0
0.8
24.1
25.6
-
-
Cholamandalam Inv. &
Neutral
1,284
-
20,076
2,826
3,307
6.3
6.3
53.7
64.6
23.9
19.9
4.1
3.5
18.3
18.9
-
-
Fin. Co.
Dewan Housing Finance Buy
600
712
18,815
2,676
3,383
2.4
2.7
37.4
49.7
16.0
12.1
2.1
1.8
13.8
16.2
-
-
Equitas Holdings
Buy
140
235
4,766
1,125
1,380
9.6
9.8
1.5
6.0
93.6
23.4
2.1
2.0
2.4
8.2
-
-
Federal Bank
Buy
108
125
21,289
4,896
5,930
2.8
3.1
5.4
7.6
20.2
14.3
1.7
1.6
8.5
11.0
-
-
Stock Watch
December 04, 2017
Company Name
Reco
CMP
Target
Mkt Cap
Sales ( Čcr )
OPM(%)
EPS (Č)
PER(x)
P/BV(x)
RoE(%)
EV/Sales(x)
(Č)
Price ( Č)
( Č cr )
FY18E FY19E
FY18E
FY19E
FY18E
FY19E
FY18E
FY19E
FY18E
FY19E
FY18E
FY19E
FY18E
FY19E
Financials
GIC Housing
Buy
435
655
2,343
376
477
3.6
3.7
33.0
40.0
13.2
10.9
2.4
2.0
20.0
23.0
-
-
HDFC Bank
Neutral
1,844
-
477,135
55,236
63,253
4.5
4.4
68.9
82.4
26.8
22.4
4.7
3.9
18.7
18.5
-
-
ICICI Bank
Neutral
305
-
195,999
42,361
51,378
3.6
3.9
18.4
25.7
16.6
11.9
1.8
1.8
11.3
15.0
-
-
Karur Vysya Bank
Buy
117
180
8,411
3,289
3,630
3.7
3.9
10.8
14.1
10.8
8.3
1.3
1.2
12.5
14.7
-
-
LIC Housing Finance
Accumulate
571
630
28,809
4,895
6,332
3.4
3.7
50.7
66.8
11.3
8.6
2.2
1.9
21.7
23.8
-
-
Punjab Natl.Bank
Neutral
171
-
36,463
23,708
25,758
2.1
2.1
5.9
16.4
29.2
10.4
0.9
0.8
3.0
8.3
-
-
RBL Bank
Neutral
521
-
21,693
2,309
2,888
2.6
2.5
16.4
19.1
31.8
27.3
4.0
3.6
13.3
13.8
-
-
Repco Home Finance
Buy
612
825
3,826
496
597
4.4
4.2
38.5
48.7
15.9
12.6
2.9
2.4
19.6
20.6
-
-
South Ind.Bank
Neutral
32
-
5,724
3,195
3,567
3.0
3.1
3.0
3.8
10.5
8.3
1.1
0.9
10.5
11.9
-
-
St Bk of India
Neutral
313
-
269,795
105,827
121,056
2.4
2.5
16.1
25.6
19.4
12.2
1.5
1.4
6.6
9.9
-
-
Union Bank
Neutral
158
-
11,463
14,650
16,225
2.3
2.3
23.1
32.5
6.8
4.9
0.5
0.5
7.1
9.2
-
-
Yes Bank
Neutral
307
-
70,422
11,088
13,138
3.0
2.9
84.0
99.3
3.7
3.1
0.6
0.5
16.3
16.8
-
-
FMCG
Akzo Nobel India
Neutral
1,782
-
8,546
3,164
3,607
13.8
13.7
58.6
67.9
30.4
26.2
7.5
6.6
24.5
25.1
2.6
2.2
Asian Paints
Neutral
1,136
-
108,974
17,603
20,615
18.6
18.6
2,128.9
2,543.3
0.5
0.5
11.3
9.5
28.0
28.9
6.0
5.0
Britannia
Neutral
4,799
-
57,621
9,690
11,278
14.8
15.4
84.0
101.0
57.1
47.5
20.8
16.6
40.6
39.0
5.9
5.1
Colgate
Neutral
1,030
-
28,001
4,420
5,074
24.9
25.3
28.6
32.8
36.0
31.4
14.2
11.5
43.8
40.5
6.1
5.3
Dabur India
Neutral
341
-
60,121
8,346
9,344
19.6
19.9
7.8
9.0
43.8
37.9
8.8
8.0
25.2
24.8
6.8
6.0
GlaxoSmith Con*
Neutral
6,078
-
25,561
5,072
5,760
18.2
18.4
176.3
199.2
34.5
30.5
7.3
6.6
21.2
21.7
4.4
3.8
Godrej Consumer
Neutral
975
-
66,413
10,171
11,682
20.8
21.5
21.7
27.1
44.9
36.0
10.1
8.7
22.3
23.4
6.6
5.7
HUL
Neutral
1,252
-
271,069
37,077
41,508
20.3
21.8
5,189.9
6,318.5
0.2
0.2
38.2
32.6
74.8
82.0
7.2
6.4
ITC
Neutral
255
-
311,165
44,588
49,853
37.0
37.3
9.6
11.0
26.6
23.2
6.5
6.2
25.1
27.3
6.5
5.7
Marico
Neutral
309
-
39,924
6,788
7,766
18.5
19.2
7.1
8.5
43.6
36.4
15.2
13.1
36.9
38.0
5.7
5.0
Nestle*
Neutral
7,704
-
74,275
10,083
11,182
20.0
20.9
119.7
141.3
64.4
54.5
226.8
207.3
36.7
39.8
7.0
6.3
Tata Global
Neutral
284
-
17,896
7,121
7,641
11.9
12.3
6.9
8.0
41.1
35.4
2.7
2.6
6.8
7.2
2.3
2.1
Procter & Gamble
Neutral
9,511
-
30,873
3,034
3,579
27.1
27.7
167.7
198.8
56.7
47.8
15.2
13.1
28.8
29.5
9.6
8.0
Hygiene
IT
HCL Tech^
Buy
830
1,014
118,376
50,009
54,608
22.1
22.1
62.8
67.6
13.2
12.3
3.0
2.5
22.4
20.6
2.0
1.7
Infosys
Buy
959
1,120
220,167
70,333
75,960
26.0
26.0
61.7
65.9
15.5
14.5
2.9
2.7
18.9
18.7
2.5
2.3
TCS
Reduce
2,631
2,442
503,563
123,384
134,488
26.1
26.1
133.2
143.7
19.8
18.3
5.5
5.1
27.6
27.8
3.7
3.4
Tech Mahindra
Accumulate
473
526
46,174
30,545
32,988
15.0
15.0
35.2
37.6
13.4
12.6
2.3
2.1
16.8
16.2
1.3
1.1
Stock Watch
December 04, 2017
Company Name
Reco
CMP
Target
Mkt Cap
Sales ( Čcr )
OPM(%)
EPS (Č)
PER(x)
P/BV(x)
RoE(%)
EV/Sales(x)
(Č)
Price ( Č)
( Č cr )
FY18E FY19E
FY18E
FY19E
FY18E
FY19E
FY18E
FY19E
FY18E
FY19E
FY18E
FY19E
FY18E
FY19E
IT
Wipro
Neutral
289
-
140,866
54,164
56,544
22.3
22.3
18.8
19.5
15.4
14.8
2.5
2.1
15.0
13.6
1.8
1.6
Media
D B Corp
Neutral
361
-
6,650
2,404
2,625
30.5
31.5
23.7
26.9
15.3
13.4
3.6
3.1
23.5
22.8
2.6
2.4
HT Media
Neutral
102
-
2,369
2,589
2,830
15.1
15.4
8.3
10.9
12.3
9.3
1.0
0.9
8.4
10.4
0.5
0.3
Jagran Prakashan
Buy
164
225
5,112
2,541
2,835
28.5
28.7
12.7
14.1
12.9
11.6
2.7
2.3
21.3
21.4
1.9
1.6
Sun TV Network
Neutral
855
-
33,712
3,238
3,789
51.9
55.1
30.9
38.0
27.7
22.5
7.9
6.9
30.0
31.0
9.9
8.4
Hindustan Media
Neutral
246
-
1,805
1,002
1,074
23.3
23.5
29.2
33.8
8.4
7.3
1.3
1.1
15.6
15.4
0.8
0.5
Ventures
TV Today Network
Accumulate
383
435
2,287
667
727
27.7
27.7
18.6
20.1
20.6
19.1
3.2
3.3
15.6
17.3
3.0
2.8
Music Broadcast Limited Accumulate
380
434
2,166
271
317
91.0
109.0
6.0
10.0
63.3
38.0
4.0
3.6
6.5
9.3
7.6
6.2
Metals & Mining
Coal India
Neutral
272
-
168,997
82,301
91,235
17.0
18.0
17.1
20.5
15.9
13.3
3.0
2.8
45.0
55.0
1.7
1.5
Hind. Zinc
Neutral
297
-
125,407
22,108
24,555
57.0
58.0
22.1
26.3
13.4
11.3
4.4
3.5
32.0
35.0
4.7
3.9
Hindalco
Neutral
236
-
52,909
102,350
105,355
13.5
14.5
21.5
24.5
11.0
9.6
1.5
1.3
15.0
15.2
1.1
1.0
JSW Steel
Neutral
252
-
60,890
64,500
68,245
21.1
21.5
20.1
21.2
12.5
11.9
2.3
2.0
-
-
1.7
1.6
NMDC
Neutral
129
-
40,783
10,209
11,450
47.0
48.0
11.1
12.1
11.6
10.7
1.6
1.5
-
-
3.5
3.2
SAIL
Neutral
78
-
32,297
54,100
63,555
3.0
10.0
(10.0)
1.5
52.1
1.0
1.0
-
-
1.6
1.4
Vedanta
Neutral
287
-
106,572
81,206
87,345
28.0
29.0
26.5
33.5
10.8
8.6
2.5
2.1
-
-
2.1
1.8
Tata Steel
Neutral
681
-
66,111
121,445
126,500
16.2
17.2
65.4
81.3
10.4
8.4
1.7
1.4
-
-
1.1
0.9
Oil & Gas
GAIL
Neutral
456
-
77,166
53,115
52,344
14.2
15.3
30.0
31.1
15.2
14.7
1.9
1.8
-
-
1.2
1.2
ONGC
Neutral
180
-
230,677
83,111
84,934
44.2
44.9
16.4
16.9
11.0
10.6
1.3
1.2
-
-
2.6
2.6
Indian Oil Corp
Neutral
388
-
188,336
396,116
432,560
8.5
8.8
40.1
42.2
9.7
9.2
1.7
1.5
-
-
0.6
0.6
Reliance Industries
Neutral
910
-
591,748
257,711
267,438
17.0
18.2
89.1
89.5
10.2
10.2
1.0
0.9
-
-
2.0
1.9
Pharmaceuticals
Alembic Pharma
Buy
510
600
9,620
3,346
3,915
19.6
19.2
21.0
23.9
24.3
21.4
4.3
3.7
19.1
18.4
2.9
2.5
Alkem Laboratories Ltd
Accumulate
1,975
2,125
23,615
6,320
7,341
17.5
19.8
72.7
96.6
27.2
20.5
4.8
4.1
16.7
18.7
3.7
3.1
Aurobindo Pharma
Buy
673
823
39,401
17,086
19,478
22.1
22.0
44.7
51.4
15.0
13.1
3.3
2.7
24.7
22.7
2.4
2.1
Aventis*
Neutral
4,391
-
10,113
2,411
2,698
18.8
18.8
151.6
163.9
29.0
26.8
4.5
3.6
25.4
27.5
3.8
3.2
Cadila Healthcare
Neutral
427
-
43,704
11,365
12,926
20.0
20.0
18.4
20.5
23.2
20.8
5.1
4.2
24.3
22.2
3.9
3.4
Cipla
Sell
597
462
48,068
16,163
18,711
16.6
16.9
20.7
24.3
28.9
24.6
3.4
3.0
12.6
13.1
3.1
2.7
Dr Reddy's
Reduce
2,230
2,040
36,986
13,734
15,548
17.7
20.2
69.9
102.0
31.9
21.9
2.8
2.6
9.2
12.4
2.9
2.6
GSK Pharma*
Sell
2,456
2,000
20,806
2,968
3,324
13.8
15.9
37.8
46.3
65.0
53.1
11.4
12.5
16.7
22.4
6.8
6.2
Indoco Remedies
Sell
262
136
2,416
1,114
1,297
9.9
13.9
5.6
11.4
46.8
23.0
3.5
3.2
7.7
14.5
2.4
2.1
Stock Watch
December 04, 2017
Company Name
Reco
CMP
Target
Mkt Cap
Sales ( Čcr )
OPM(%)
EPS (Č)
PER(x)
P/BV(x)
RoE(%)
EV/Sales(x)
(Č)
Price ( Č)
( Č cr )
FY18E FY19E
FY18E
FY19E
FY18E
FY19E
FY18E
FY19E
FY18E
FY19E
FY18E
FY19E
FY18E
FY19E
Pharmaceuticals
Ipca labs
Accumulate
532
570
6,712
3,256
3,647
14.1
17.1
16.2
25.4
32.8
20.9
2.5
2.3
8.0
11.5
2.1
1.9
Lupin
Buy
814
1,091
36,796
16,240
18,562
21.3
21.7
42.5
49.6
19.2
16.4
2.4
2.1
13.3
13.7
2.4
2.0
Natco Pharma
Accumulate
956
1,057
16,679
1,886
2,016
32.3
29.5
23.2
22.0
41.3
43.4
8.6
7.7
20.9
17.6
8.7
8.1
Sun Pharma
Buy
526
615
126,188
28,312
31,826
20.7
22.4
18.5
22.3
28.4
23.6
3.2
2.9
11.5
14.0
4.1
3.5
Syngene International
Accumulate
550
587
11,003
1,394
1,818
33.0
36.5
15.8
21.0
34.8
26.2
6.5
5.3
18.6
20.3
7.9
6.0
Power
Tata Power
Neutral
90
-
24,411
32,547
33,806
20.5
20.5
4.7
5.4
19.2
16.9
1.8
1.6
10.5
10.5
1.7
1.7
NTPC
Neutral
181
-
149,367
86,070
101,246
28.3
30.7
12.9
16.2
14.0
11.2
1.5
1.3
10.6
12.4
3.1
2.8
Power Grid
Accumulate
203
223
106,123
29,183
32,946
89.7
90.0
18.0
20.8
11.3
9.8
1.9
1.7
17.7
18.2
7.6
7.0
Real Estate
Prestige Estate
Neutral
331
-
12,411
4,607
5,146
21.0
22.2
7.9
9.8
41.9
33.8
2.6
2.4
10.3
12.0
3.9
3.5
MLIFE
Accumulate
467
522
2,398
487
590
12.3
17.8
21.0
31.2
22.3
15.0
1.2
1.1
5.2
7.4
3.6
3.0
Telecom
Bharti Airtel
Neutral
483
-
193,174
97,903
105,233
36.0
36.3
9.3
11.1
52.0
43.7
2.5
2.4
5.0
5.6
2.9
2.7
Idea Cellular
Neutral
93
-
33,602
35,012
37,689
27.1
27.7
(4.4)
(2.7)
1.5
1.5
(6.8)
(4.6)
2.3
2.0
zOthers
Abbott India
Neutral
5,263
-
11,183
3,244
3,723
14.9
16.1
167.5
209.4
31.4
25.1
6.9
5.8
23.7
24.8
3.1
2.6
Asian Granito
Accumulate
505
570
1,521
1,169
1,286
12.5
12.5
16.0
19.7
31.6
25.6
3.4
3.0
10.7
11.6
1.5
1.4
Bajaj Electricals
Neutral
450
-
4,578
4,646
5,301
6.7
7.6
16.1
22.3
28.0
20.2
4.6
3.9
16.4
19.2
1.0
0.9
Banco Products (India)
Neutral
246
-
1,762
1,530
1,695
13.2
12.7
19.0
20.0
13.0
12.3
2.1
1.8
0.2
0.2
1.1
118.6
Coffee Day Enterprises
Neutral
267
-
5,490
3,494
3,913
17.4
18.0
4.8
5.7
-
46.8
2.4
2.3
-
0.1
2.0
1.8
Ltd
Elecon Engineering
Neutral
84
-
939
171
201
15.0
16.2
36.0
43.0
2.3
2.0
0.2
0.2
0.1
0.1
4.9
4.1
Garware Wall Ropes
Neutral
913
-
1,998
928
1,003
15.2
15.2
39.4
43.2
23.2
21.2
3.8
3.3
16.5
15.4
2.0
1.8
Goodyear India*
Neutral
838
-
1,934
1,717
1,866
11.8
12.3
47.9
49.8
17.5
16.8
2.7
2.3
15.6
15.7
0.8
117.7
Hitachi
Neutral
2,500
-
6,797
2,355
2,715
10.3
10.8
49.0
60.9
51.0
41.0
11.9
9.4
0.2
0.2
2.9
2.5
HSIL
Neutral
497
-
3,593
2,240
2,670
14.6
15.0
17.0
22.0
29.2
22.6
2.4
2.3
0.1
0.1
1.8
1.5
Interglobe Aviation
Neutral
1,131
-
43,452
22,570
27,955
14.2
15.0
63.6
81.8
17.8
13.8
9.4
7.9
0.5
0.6
1.6
1.2
Jyothy Laboratories
Neutral
386
-
7,010
1,781
2,044
14.1
15.0
9.4
10.5
41.2
36.7
8.8
8.2
0.2
0.2
4.2
3.6
Linc Pen & Plastics
Neutral
300
-
443
420
462
9.3
9.3
15.3
17.1
19.6
17.5
3.3
3.4
16.9
19.5
1.1
1.0
M M Forgings
Neutral
921
-
1,111
542
642
20.1
21.0
41.6
56.8
22.1
16.2
3.1
2.6
0.1
0.2
2.5
2.1
Mirza International
Neutral
157
-
1,894
1,148
1,285
18.0
18.0
8.0
9.4
19.6
16.8
3.2
2.7
16.3
16.1
1.8
1.6
Navkar Corporation
Buy
184
265
2,776
561
617
41.5
41.5
11.5
12.7
16.0
14.5
1.7
1.5
10.5
10.4
5.6
4.9
Nilkamal
Neutral
1,742
-
2,599
2,317
2,525
11.4
11.1
96.0
105.0
18.2
16.6
3.1
2.7
0.2
0.2
1.1
1.0
Stock Watch
December 04, 2017
Company Name
Reco
CMP
Target Mkt Cap
Sales ( Čcr )
OPM(%)
EPS (Č)
PER(x)
P/BV(x)
RoE(%)
EV/Sales(x)
(Č)
Price ( Č)
( Č cr )
FY18E FY19E FY18E FY19E FY18E FY19E FY18E FY19E FY18E FY19E FY18E FY19E FY18E FY19E
zOthers
Parag Milk Foods
Neutral
242
-
2,034
1,987
2,379
7.6
9.0
12.4
18.3
19.5
13.2
2.7
2.4
8.2
13.2
1.1
1.0
Radico Khaitan
Neutral
262
-
3,486
1,811
1,992
13.2
13.2
8.1
8.8
32.3
29.7
3.3
3.6
10.1
12.0
2.3
2.0
Relaxo Footwears
Neutral
604
-
7,265
1,981
2,310
13.7
14.5
12.0
15.5
50.3
38.9
9.8
7.9
0.2
0.2
3.7
3.2
Siyaram Silk Mills
Neutral
687
-
3,221
1,769
1,981
12.7
12.7
22.6
26.2
30.4
26.2
4.7
4.1
15.5
15.5
2.0
1.8
Styrolution ABS India* Neutral
1,086
-
1,910
1,800
1,980
8.0
8.1
42.0
46.2
25.9
23.5
2.9
2.6
0.1
0.1
1.2
1.1
Surya Roshni
Neutral
375
-
1,644
4,870
5,320
7.7
7.8
22.8
28.1
16.5
13.4
2.2
1.9
0.1
0.1
0.6
0.5
TVS Srichakra
Neutral
3,346
-
2,562
2,729
2,893
12.7
12.5
248.5
265.0
13.5
12.6
3.8
3.1
0.3
0.3
0.9
0.9
Visaka Industries
Neutral
640
-
1,017
1,104
1,214
12.1
12.6
31.0
37.9
20.7
16.9
2.5
2.3
0.1
0.1
1.1
1.0
VIP Industries
Accumulate
361
400
5,104
1,450
1,693
10.4
10.5
6.5
7.8
55.2
46.3
11.7
10.2
21.1
22.1
3.5
3.0
Navin Fluorine
Neutral
697
-
3,438
945
1,154
17.5
17.9
28.7
34.8
24.3
20.0
4.0
3.4
-
-
3.2
2.5
Century Plyboards India #N/A
2,007
2,510
22.4
22.6
8.4
11.1
21.3
22.9
LT Foods
#N/A
3,287
3,747
11.1
11.5
4.4
5.2
17.5
17.6
Source: Company, Angel Research; Note: *December year end; #September year end; &October year end; Price as on December 02, 2017
Market Outlook
December 04, 2017
Research Team Tel: 022 - 39357800
DISCLAIMER
Angel Broking Private Limited (hereinafter referred to as “Angel”) is a registered Member of National Stock Exchange of India
Limited,Bombay Stock Exchange Limited and Metropolitan Stock Exchange Limited. It is also registered as a Depository Participant with
CDSL and Portfolio Manager with SEBI. It also has registration with AMFI as a Mutual Fund Distributor. Angel Broking Private Limited is a
registered entity with SEBI for Research Analyst in terms of SEBI (Research Analyst) Regulations, 2014 vide registration number
INH000000164. Angel or its associates has not been debarred/ suspended by SEBI or any other regulatory authority for accessing
/dealing in securities Market. Angel or its associates/analyst has not received any compensation / managed or
co-managed public offering of securities of the company covered by Analyst during the past twelve months.
This document is solely for the personal information of the recipient, and must not be singularly used as the basis of any investment
decision. Nothing in this document should be construed as investment or financial advice. Each recipient of this document should make
such investigations as they deem necessary to arrive at an independent evaluation of an investment in the securities of the companies
referred to in this document (including the merits and risks involved), and should consult their own advisors to determine the merits and
risks of such an investment.
Reports based on technical and derivative analysis center on studying charts of a stock's price movement, outstanding positions and
trading volume, as opposed to focusing on a company's fundamentals and, as such, may not match with a report on a company's
fundamentals. Investors are advised to refer the Fundamental and Technical Research Reports available on our website to evaluate the
contrary view, if any.
The information in this document has been printed on the basis of publicly available information, internal data and other reliable
sources believed to be true, but we do not represent that it is accurate or complete and it should not be relied on as such, as this
document is for general guidance only. Angel Broking Pvt. Limited or any of its affiliates/ group companies shall not be in any way
responsible for any loss or damage that may arise to any person from any inadvertent error in the information contained in this report.
Angel Broking Pvt. Limited has not independently verified all the information contained within this document. Accordingly, we cannot
testify, nor make any representation or warranty, express or implied, to the accuracy, contents or data contained within this document.
While Angel Broking Pvt. Limited endeavors to update on a reasonable basis the information discussed in this material, there may be
regulatory, compliance, or other reasons that prevent us from doing so.
This document is being supplied to you solely for your information, and its contents, information or data may not be reproduced,
redistributed or passed on, directly or indirectly.
Neither Angel Broking Pvt. Limited, nor its directors, employees or affiliates shall be liable for any loss or damage that may arise from
or in connection with the use of this information.